Triangle Visualizer & Calculator
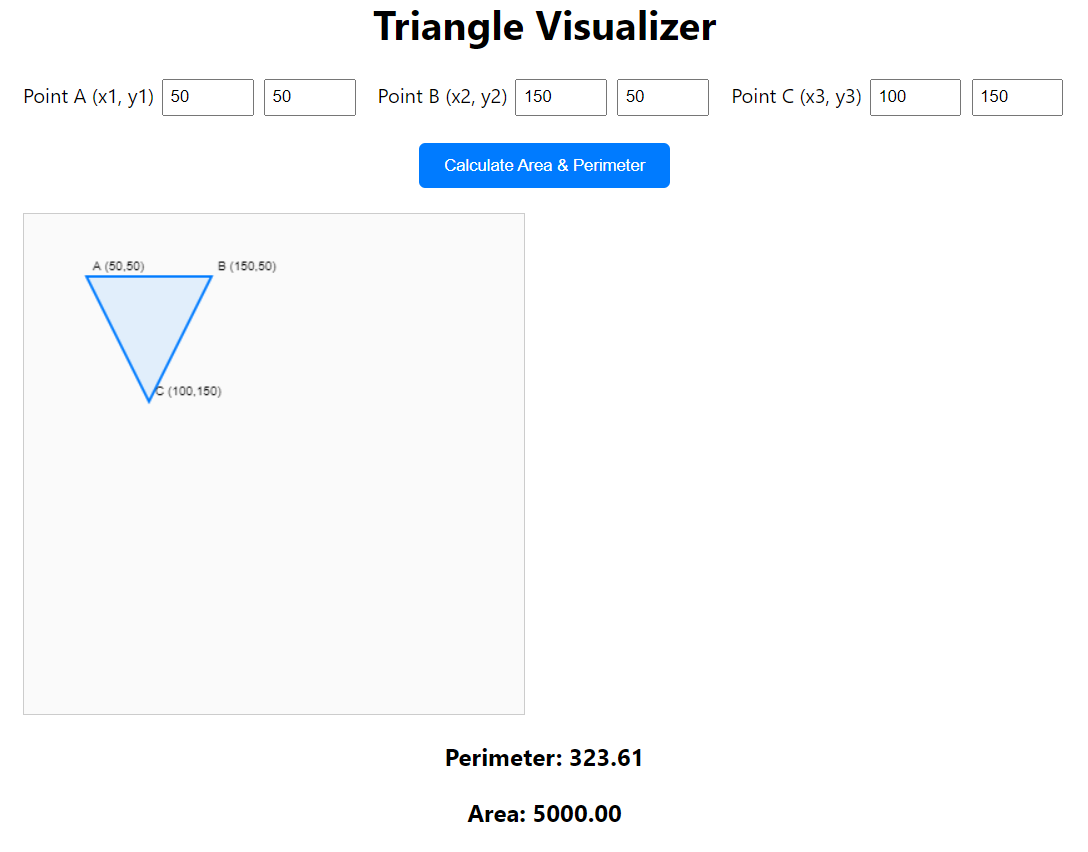
The Triangle Visualizer is a utility designed to bridge the gap between abstract coordinate geometry and visual representation. While many calculators provide numeric outputs, this project allows users to see exactly how shifting a single vertex in a Cartesian plane alters the shape’s area and perimeter. The application features a responsive input grid where users can define three distinct points (x, y), which are then instantly reflected on a 400x400 HTML5 Canvas element.
For this project, I handled the full-stack front-end implementation, focusing on the mathematical logic and the real-time rendering engine. I utilized the Canvas API to handle the drawing logic, ensuring that labels and vertex coordinates updated dynamically as the user typed. One of the more interesting challenges was implementing the Shoelace Formula to calculate the area of the triangle regardless of its orientation or vertex order. I also applied a clean, modern aesthetic using CSS Grid and Flexbox to ensure the interface remained intuitive and visually grounded.
Here is JavaScript implementation of the Shoelace Formula used to determine the triangle’s area:
function triangleArea(x1, y1, x2, y2, x3, y3) {
    // Using the Shoelace Formula for area via coordinates
    return 0.5 * Math.abs(x1 * (y2 - y3) + x2 * (y3 - y1) + x3 * (y1 - y2));
}
The perimeter calculation follows the standard distance formula for each side, $d = \sqrt{(x_2 - x_1)^2 + (y_2 - y_1)^2}$ , summing the results to provide the total boundary length. The result is a lightweight, educational tool that demonstrates the power of combining mathematical algorithms with the native capabilities of the modern web browser.
Click the link to view the Triangle Visualizer & Calculator.